What’s New
Maintenance KPI Page for Enterprise Metrics
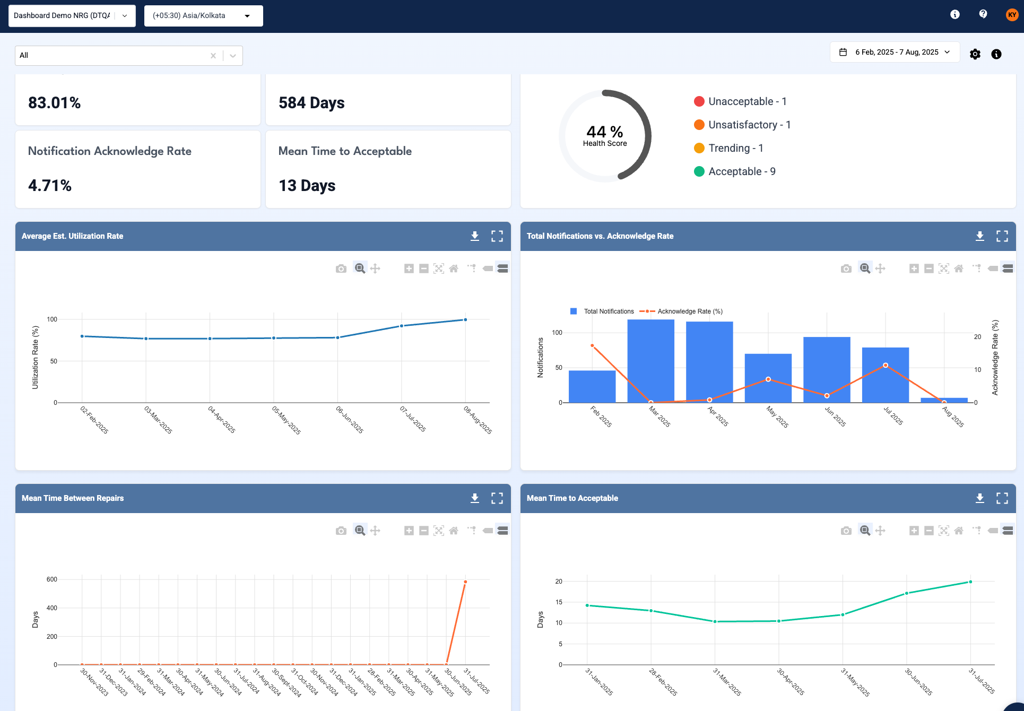
A comprehensive new Maintenance KPI Page has been added to the Enterprise Metrics section. This page centralizes all key maintenance performance indicators, providing users with actionable insights, detailed trends, and flexible filtering to support informed decision-making. By consolidating metrics and trends in one location, this addition enables organizations to closely monitor and optimize predictive maintenance outcomes.
Key features:
- Time Window Selector: A date-range picker allows users to filter all KPI data and charts by a specific date range, with a default range of the last 6 months and a minimum window of 31 days. All backend queries and visualizations are dynamically updated based on the selected window, supporting precise time-based analysis.
- Plant & Company Selector: KPI data can now be filtered by individual plants and/or company, using multi-select dropdowns and search, to enable comparison across multiple operational sites and organizations.
- Key Metric Cards:
- High-level KPI cards display:
- Average Estimated Utilization (The average Utilization Factor across all equipment)
- Notification Acknowledge Rate (A function of the number of acknowledged notifications divided by the total notifications generated)
- Mean Time Between Repairs (The mean duration between repairs recorded on an equipment basis)
- Mean Time to Acceptable (The mean duration for equipment to arrive at an Acceptable state following periods of being either Unsatisfactory or Unacceptable)
- Note: Each card uses standardized calculations and updates in real-time as filters are applied.
- High-level KPI cards display:
- Monthly KPI Trends:
- Mean Time Between Repair Trend: A line chart visualizes how the mean time between repairs changes over time.
- Mean Time to Acceptable Trend: A trend chart shows the average time taken for equipment to return to acceptable health.
- Notifications vs. Acknowledge Rate: A dual-axis chart displays monthly notification counts alongside acknowledgment rates for comprehensive performance analysis.
- Utilization Rate Trend: A trend chart highlights average utilization rate changes by month.
- Data Handling: All metrics use consistent sampling and aggregation methods, ensuring data integrity and comparability. Tooltips provide clear context on all charts and cards.
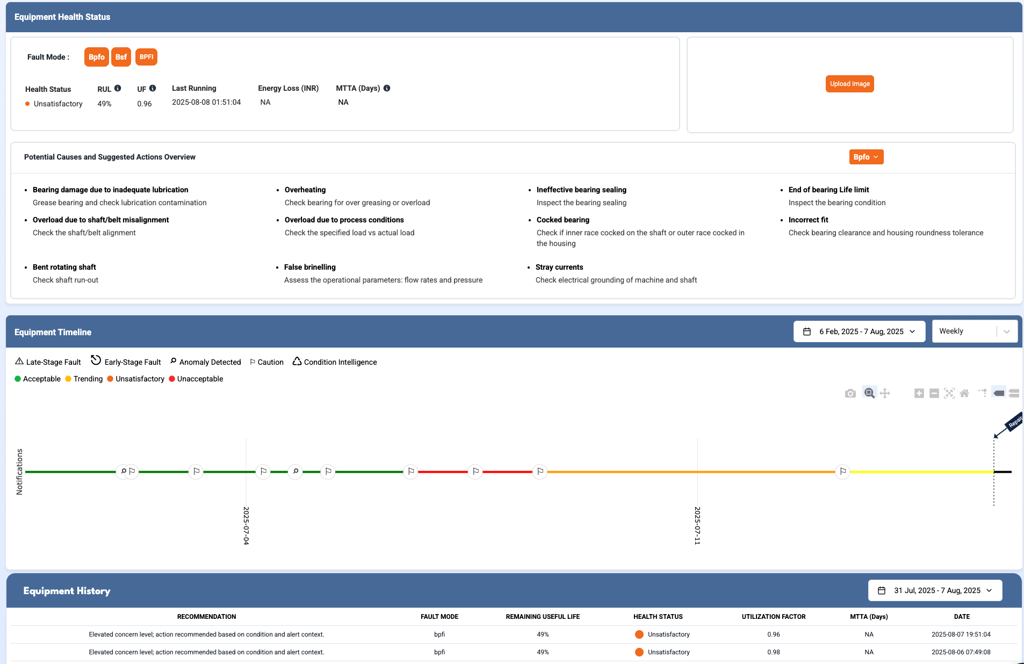
Revised Health Summary Page with MTTA
A revision to the Equipment Health Summary page, introducing both visual refinements and expanded analytics. These changes enable users to quickly assess asset health status, understand fault patterns, and monitor overall maintenance progress.
- Updated Health Summary Labels: Health summary labels have been revised for greater clarity and alignment with platform terminology. The “(Stage: )” label has been removed from the health summary section to declutter the interface and streamline information presentation.
- Addition of MTTA (Mean Time to Acceptable): The Health Status and History sections now display MTTA, providing deeper visibility into the average time required for equipment to return to an acceptable condition.
- Standardized Fault Button Colors: All fault-related actions now use a consistent button color scheme, improving recognition and user experience.
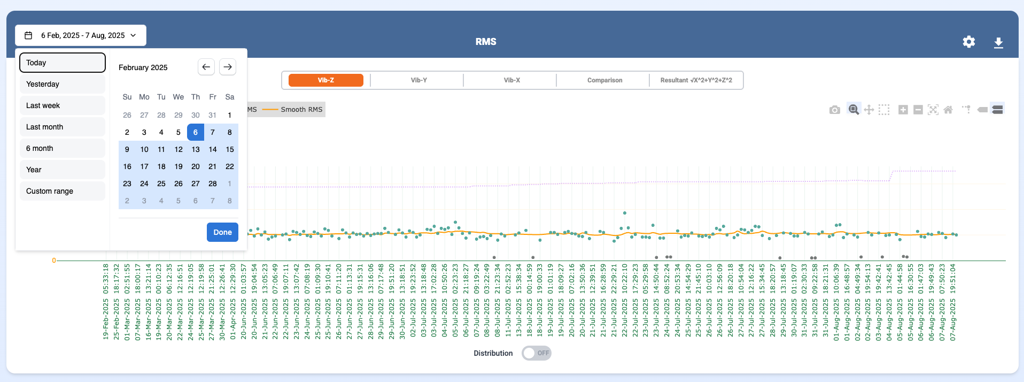
UI Chart Buttons and Time Selector Standardization
To promote usability and consistency across the platform, chart navigation buttons and time selectors have been modernized. This enhancement ensures users encounter a unified experience regardless of which dashboard or page they access.
Details include:
- Removal of the orange “Day, Week, Month, 6 Month, Year” buttons at the bottom of eachchart (other buttons remain unaffected).
- All from/to date range selectors are now replaced with a standardized date selector module with an easy to use calendar for selecting date ranges.
- Default date range behavior and any single-date selector functionality are maintained asbefore.
- These updates apply to NRG, Mutliview, Enterprise Metrics, Equipment/Notification Log filters, and all time series charts.
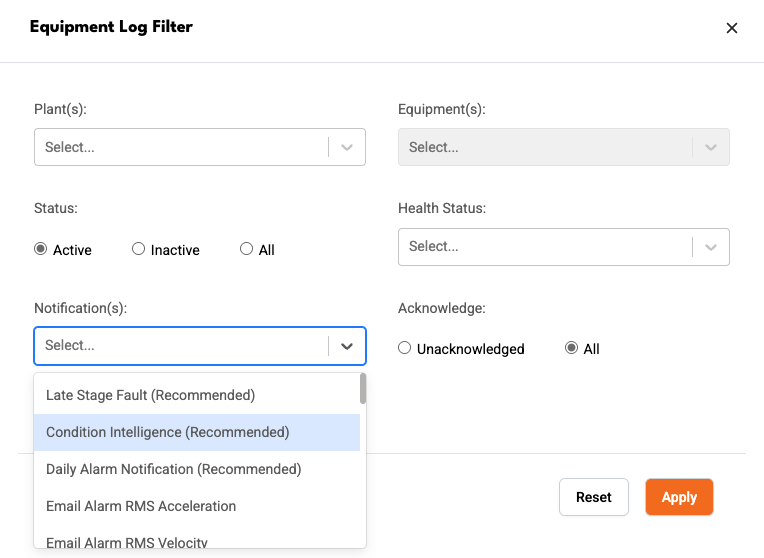
Equipment Log Filter for Notifications
Improvements have been made to notification filtering within the Equipment Log to offer users more control and clarity. This change streamlines workflows and ensures that only relevant notifications are surfaced when searching or filtering.
Enhancements include:
- Filter label changed from “Associated Notification(s)” to “Notification(s).”
- When filtering by notifications, the equipment and component cards only displaynotification counts and lists for the filtered selection(s).
- Notification lists under each component dynamically update to reflect current filters.
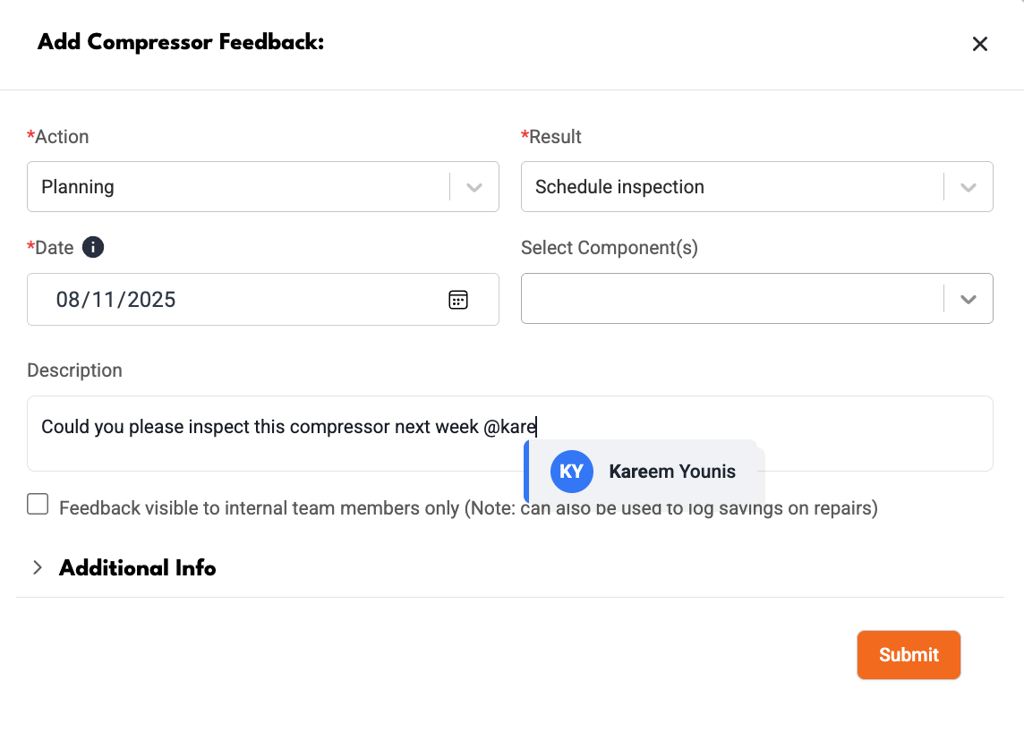
User Tagging in Feedback Description
Feedback forms now support user tagging, making it easier to notify colleagues about specific feedback items and foster collaboration.
New capabilities:
- Users can tag others in the description field using the @ symbol, with autofill based on company user lists.
- Tagged users appear in highlighted formatting, and tags trigger notification emails when feedback is edited or resubmitted (not on deletion).
- Tagged users will receive an email with the feedback contents.
Updated Monochrome Notification Icons
Notification icons have been updated to a standardized set of monochrome emojis, improving clarity and visual consistency throughout the platform.
- Late Stage Fault: ⚠︎
- Early Stage Fault: ⎋
- Condition Intelligence: ♺
- Anomaly Detected: ⌕
- Caution: ⚐
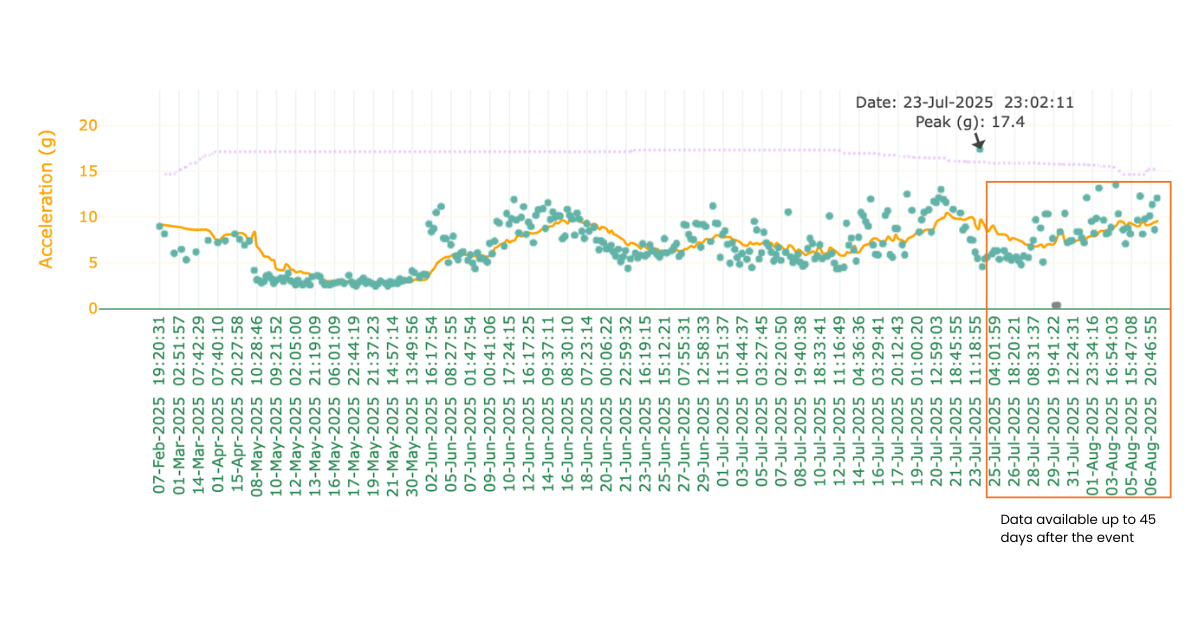
Notifications Redirect Annotation Repositioned
The positioning of notification annotations in chart visualizations has been improved for better accuracy and context. This affects notifications that are automatically annotated in charts after redirecting from the notification link.
- Notifications related to the most recent data (today) remain at the rightmost chart edge.
- Older notifications are now shown with available data up to 45 days after the event, shifting the annotation point left for better contextual visibility.
Improved All Equipment Page Sorting
Sorting logic on the All Equipment page has been enhanced for a more intuitive browsing experience.
- Plants and equipment are now sorted independently (ascending/descending alpha numeric order).
- For each plant, equipment is sorted in ascending order by default.
- Sorting is separated and clearly indicated, with plant sorting no longer affecting equipment order.
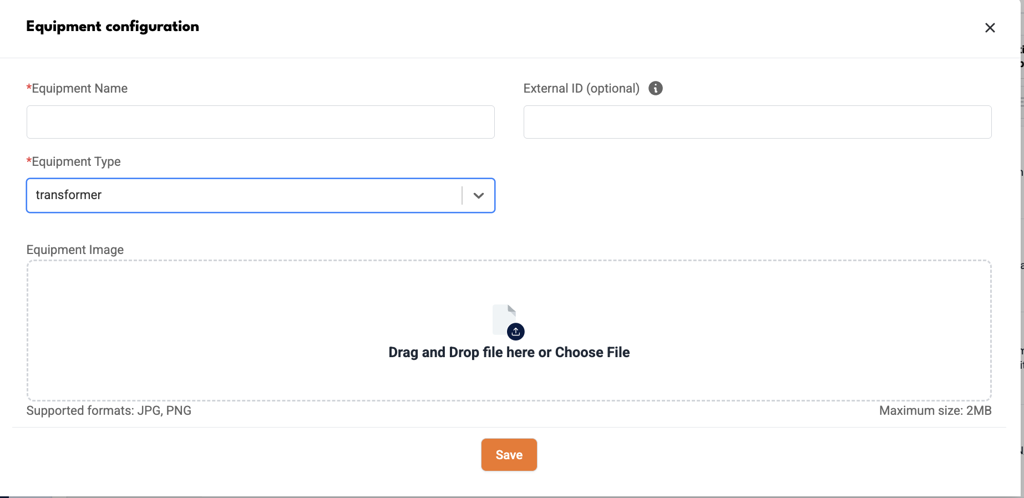
Removal of Speed-Related Question for Transformer Equipment Type
As part of a data refinement, the “Constant and Variable Speed” question has been removed for equipment of type Transformer. This change has been made because transformer components do not include speed-related attributes, making the question irrelevant.
Removal of Unnecessary Pop-up Messages to Enhance User Experience
To enhance usability and reduce visual clutter, we’ve streamlined pop-up messages across key workflows. Only those that provide meaningful and actionable feedback are now retained, ensuring a more focused and efficient experience.
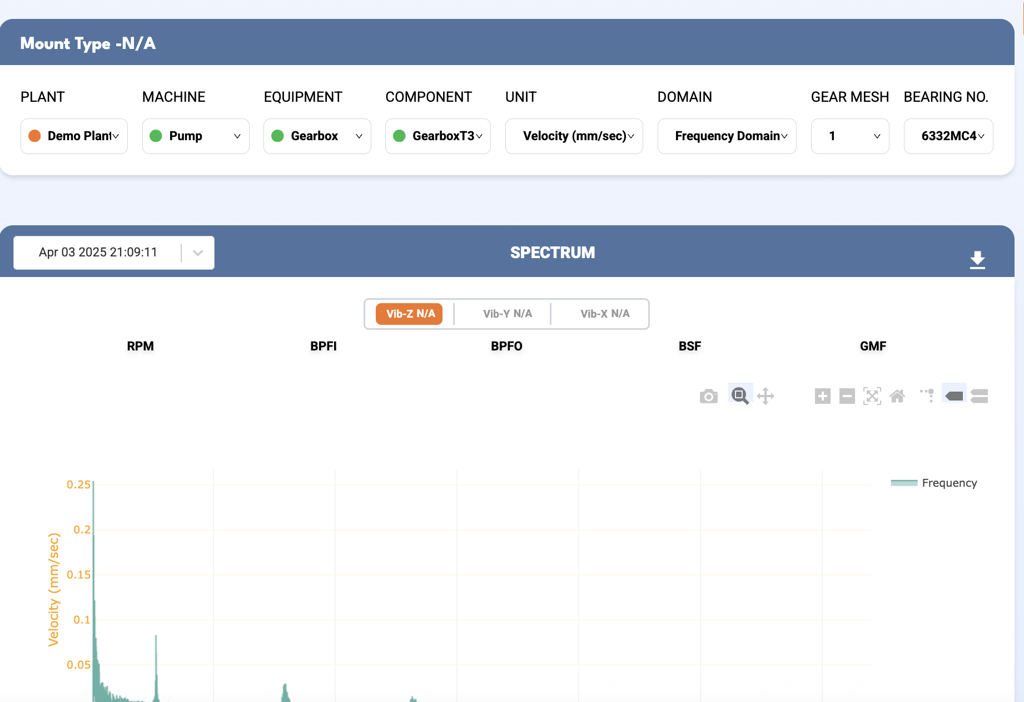
Updated Selection Flow for Gearbox Component Graph Visualization
In the current workflow for gearbox component visualization in graphs, users are first prompted to select the Bearing Number, followed by the Gear Mesh.
This flow is unintuitive, as users are not aware of which Bearing Number is associated with a given Gear Mesh, leading to confusion and incorrect selections.
- The selection flow has been updated to display the Gear Mesh field first.
- Once a Gear Mesh is selected, the Bearing Number field will be dynamically populated with only the relevant options.
- The Bearing Number will follow these selections to ensure the context is correct.
Automatic Shifting of Harmonics Based on New Selection
Previously, when a new harmonic was selected in the Harmonics graph, the subsequent markers did not automatically adjust based on the new selection. This required manual intervention and could lead to misalignment in harmonic analysis.
This release introduces logic to ensure that harmonics shift automatically, improving usability and accuracy.
Harmonics are now automatically recalculated and repositioned based on the new marker selected.