What’s New
AI Algorithms: Condition Intelligence
Condition Intelligence is a smarter, AI-driven enhancement to Nanoprecise’s platform that monitors 18+ vibration parameters at once, adapts to real-world conditions, and delivers fewer, high-confidence alerts. Condition Intelligence filters out irrelevant fluctuations, highlights significant deviations in machine health, and enables earlier detection—helping maintenance teams move from reactive maintenance to truly intelligent upkeep without added effort or cost.
Condition Intelligence is now embedded across the Nanoprecise platform by:
- Multivariate Analysis: Detecting correlated changes, not isolated spikes
- Adaptive Learning: Continuously refining baselines as machine behavior evolves
- Sophisticated Insights: Capturing anomalies and long-term trends
- Smart Notifications: Prioritizing alerts based on severity and operational impact
Nanoprecise Condition Intelligence can now be observed in notifications with the following icon: ? Condition Intelligence.
An example Condition Intelligence notification will include relevant information to severe changes detected by the Nanoprecise Machine Doctor. Example insights in notifications related to Condition Intelligence include the following:
[CI Alert] on EQUIPMENT – Shift Detected
Condition Intelligence Notification – Immediate Review Needed
- Company
- Plant
- Equipment
- Component
- Date & Time
Detected Changes
- Velocity RMS resultant
- Acceleration RMS resultant
- Acceleration Peak resultant
Link to Data for Detected Changes
Model Trained on Data between
Recommendations for Next Steps
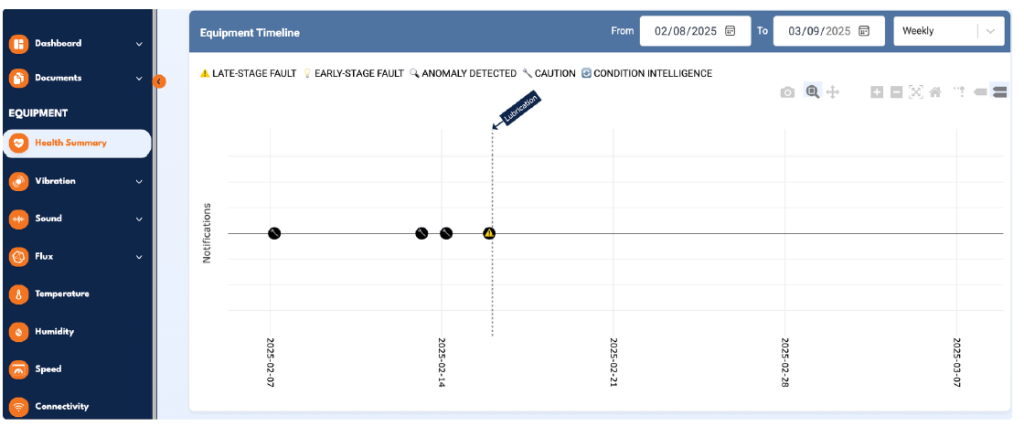
New Equipment & Component Timeline
A new timeline visualization displays the history of notifications and feedback for each piece of equipment or its individual components immediately upon landing on the Health Summary page. This provides a quick, at-a-glance overview of key activities, enabling better tracking and understanding of each machine’s maintenance and performance.
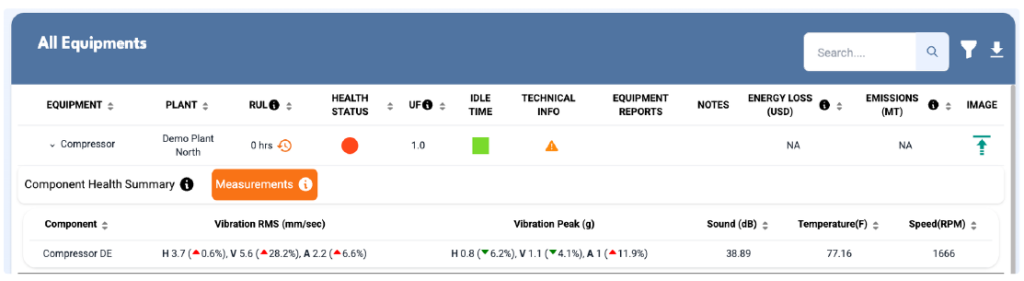
Equipment List Updates
Additions to the Equipment List page offer expanded component-level views under each piece of equipment. Under each equipment now displays:
Component Measurements
- Component: Name of the component
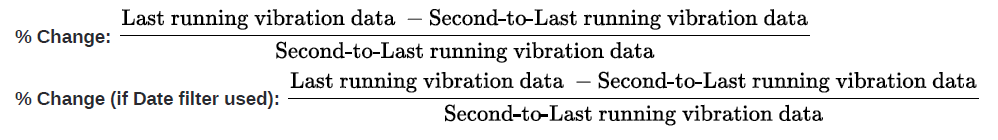
- Vibration RMS & Peak
- Value: Last running RMS data point
- Sound, Temperature, and Speed
- Pulls the last running values for each sensor data
Equipment Log Drawer Updates
Improvements to the Equipment Log Drawer enable quick maintenance recording and enhance the user experience:
- Unified Feedback Icon: A single, consistent feedback icon now appears in all relevant places, including Equipment Log Details and the Notification Log table.
- Clickable Equipment Name: The Equipment name in the Equipment Log Drawer is now clickable and redirects to the Equipment Health Summary page (with the Equipment tab selected).
- Date Auto-Adjustment: When switching an action from Planning to a non-Planning action after selecting a future date, or vice versa (from non-Planning to Planning after selecting a past date), the date field resets to today’s date automatically.
- Improved UI
- The caret (arrow) now flips direction correctly based on whether the content is expanded or collapsed.
- The icon for downloading files in the feedback thread has been updated.
- When there are no notifications in the drawer, the standard “View More/View Less” toggle is available.
- Only one feedback item is shown when collapsed.
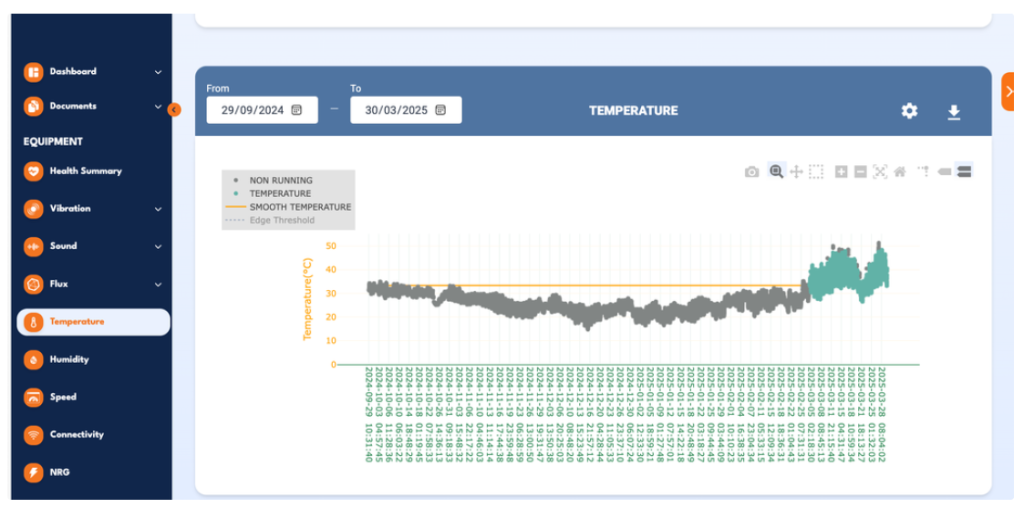
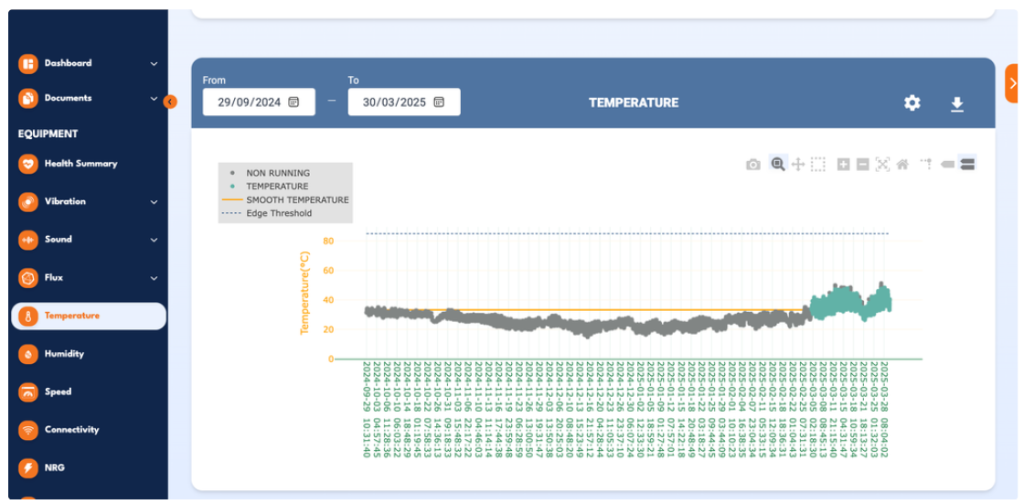
Anomaly Threshold Line Behavior & Renaming Update
The threshold line display in visualizations has been improved, and its title has been updated for clarity.
- The Anomaly Threshold line is now hidden by default in charts and graphs.
- Users can toggle the line on or off using the legend
- The threshold line has been renamed from “Anomaly Threshold” to “Edge Threshold” for better context and consistency.
Graph Visualization Enhancements: Nano AI & Email Alarm Lines
Enhancements have been applied to the Email alarm and Nano AI threshold lines for ease of monitoring.
Both the Email Alarm Line and the Nano AI Threshold Line are now displayed as dotted lines, matching the style of the Stage 4 Threshold for visual consistency.
The Nano AI Alarm Line in the Vibration Amplitude graphs has been renamed to “Nano AI Threshold” for improved clarity.
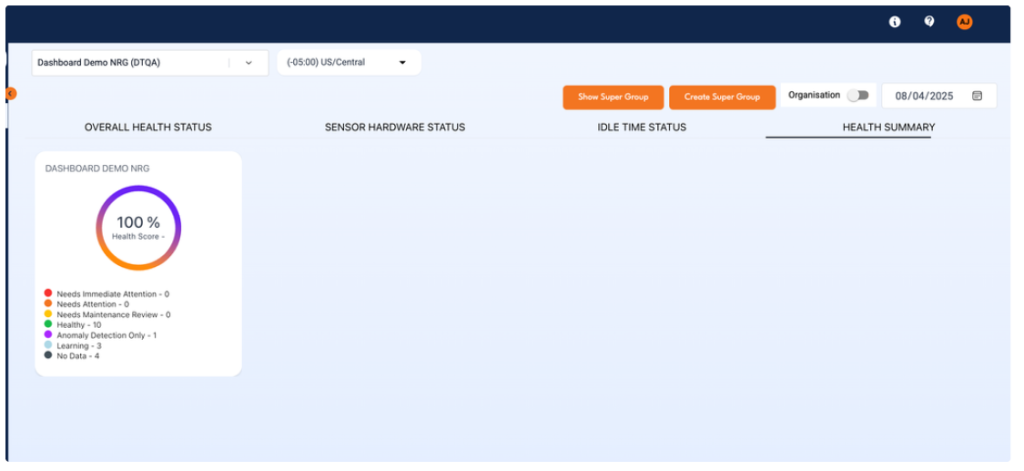
Company Health Scorecard Relocation
The Company Health Scorecard has been moved from the Homepage to the Enterprise Health
page under a new tab – “Health Summary”.
Company Health Scorecard can be visualized both at Organization as well as Company level.
Dynamic Technical Completeness Based on Equipment Configuration
The technical completeness of underlying components will now automatically adjust when the equipment configuration is changed from Constant Speed to Variable Speed.
A pop-up message is now displayed to notify users once the change is made.
“Equipment configuration updated successfully. Please verify the configuration of the underlying components and update the Max RPM value.”
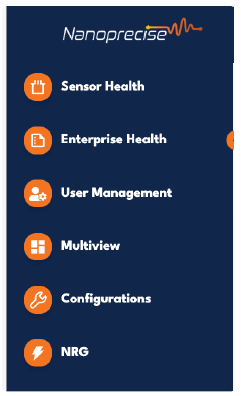
Simplified Names for All Dashboards
Dashboard names and links have been updated to provide more intuitive and user-friendly navigation.
UI/UX Enhancements: Streamlined Navigation and Settings Placement
Several interface elements have been reorganized to improve accessibility, reduce clutter, and create a more intuitive user experience.
- Feedback Config has been removed from the question mark (?) icon in the top header.
- Battery and Idle Time settings have been moved into the Alert Settings popup for easier access and centralized configuration.
- The Alert Settings popup has been relocated to the Notification Log to keep related features grouped.
- Training & Resources and Chat have been moved under the question mark (?) icon for streamlined support access.
- The Chat icon has been removed from the interface and is now accessible via “Contact Us” under the question mark (?) icon.
Enhanced Notification Redirection with Data Point Annotation
Intelligent redirection and automatic data point annotations have been introduced to improve the overall notification experience.
What’s New:
- When clicking on a notification (from emails, equipment timeline, or notification logs), users are redirected directly to the relevant chart or data view.
- The specific data point that triggered the notification will be automatically annotated using its timestamp.
- If the notification isn’t tied to a specific data point, the system will annotate the closest matching timestamp on the chart.
- For multi-view scenarios (e.g., Condition Intelligence notifications), each chart in the view will display one annotation corresponding to the notification timestamp.
Updated Notification Icons for Consistency and Clarity
The visual presentation of notifications across the platform has been updated to enhance readability and deliver a more intuitive experience.
Notification icons have been standardized and updated across:
- Notification Logs
- Equipment Log Drawer
- Email Alerts
Fixed Search Bar in Config Dashboard Asset Tree
The Asset Tree in the Config Dashboard now features improved search functionality layout for enhanced usability.
What’s Changed:
- A scroll bar has been added to the Asset Tree for easier navigation through large lists.
- The Search bar within the Asset Tree is now fixed in position —it remains visible at the top while the user scrolls through the assets.
- Only the asset list scrolls, ensuring that the search option is always accessible.
User Management Tab in Config Dashboard
A new User Management tab has been introduced at the top of the Config Dashboard, giving Super Admins users better visibility and control over user access across their company and org.
The data shown is context-aware, based on the selection in the Company/Org selector:
- Company Selected: Displays all users within the selected company.
- Org Selected: Displays users only from the companies the logged-in user has access to within that org.
- Currently only data is visible , actions like add and delete users will be handled in upcoming releases.