What’s New
Updated Enterprise Metrics
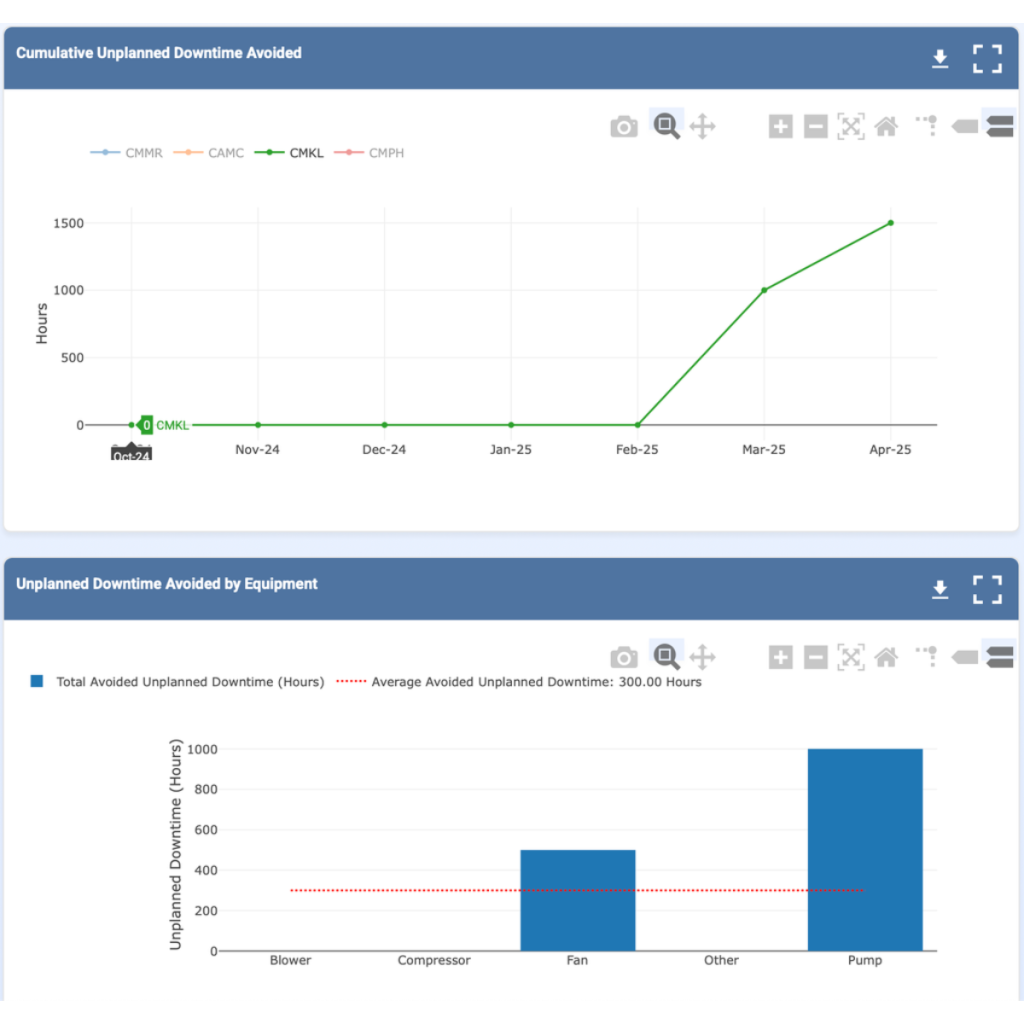
The Enterprise Health section has been renamed Enterprise Metrics. The new label aligns with Nanoprecise’s objective to deliver enterprise-scale AI and analytics. The Enterprise Metrics page retains the original health summaries and adds two new views:
| View | Purpose | How data is captured |
| Unplanned Downtime | Historic log of avoided downtime | Enter hours in the feedback form on the relevant equipment. |
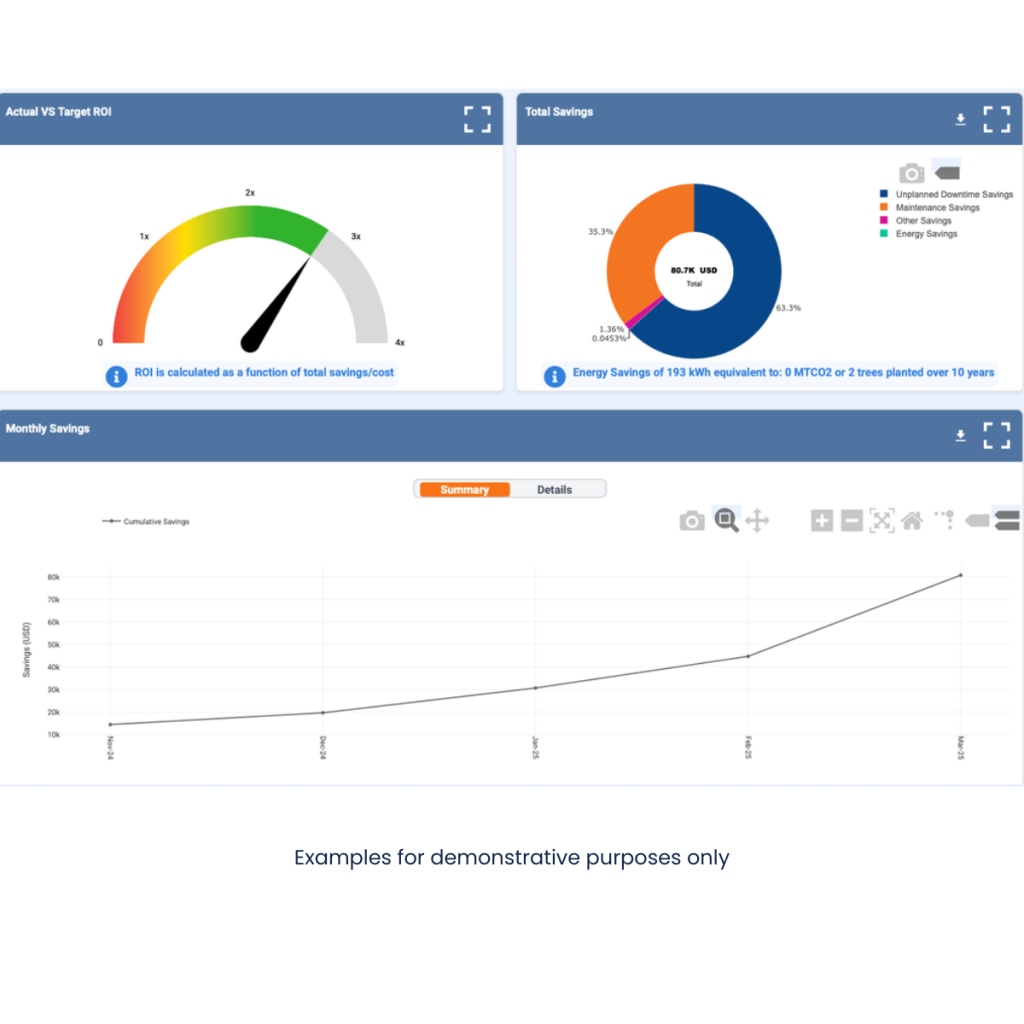
| Cost Savings (hidden by default — toggle on in Configurations → Company→ Config → Cost Savings) | Consolidates financial impact of the Predictive Maintenance program | Energy : auto-pulled from NRG data. Downtime Savings = Estimated lost-production cost × Hours avoided (both via feedback). Replacement Savings = Replacement estimate − Actual repair cost (both via feedback). Other Savings: sum of any “Other savings” values in feedback. |
New Default NRG Notifications — Platform-Wide, Customizable Energy Insights
Nanoprecise now delivers NRG Notifications —real-time, energy-focused maintenance alerts for every NRG-enabled asset on the platform.
NRG Notifications
- Enabled by default: Alerts begin the moment an asset is onboarded, requiring no initial setup.
- Fully customizable: Operations teams can define alert thresholds and subscribe to preferred delivery channels (email or SMS).
- Platform-wide coverage: Notifications are triggered across all dashboards, reports, and mobile views.
- Account-level control: Each account determines which email addresses or phone numbers receive the alerts.
Default Threshholds
- Warning: auto-set to 10 % of the motor’s rated power (0.10 × 0.746 × HP)
- Alarm: auto-set to 15 % of the motor’s rated power (0.15 × 0.746 × HP)
- NRG notifications are active by default; users may override thresholds for any equipment or component.
Graph & Popup Updates
- NRG trend charts now feature the same ⚙️settings icon used in Sound, Temperature, etc.
- Settings popup reuses the familiar threshold editor, plus:
- An “i” info footer explaining the default-threshold formula.
- Warning and Alarm fields pre-filled with the calculated defaults.
Behavior & Visual Consistency
- Alert colors, badges, and trigger logic align with existing Sound/Temperature implementations.
- User-defined thresholds persist at the equipment level across sessions.
NRG Monitor Improvements
- Pareto toggle: Each NRG chart now offers an optional cumulative-total line that can be switched on or off via the legend.
- Weekly projections:
- If equipment is idle (gray or red), the Energy (kWh) and Emissions columns show “Idle.”
- If NRG is unavailable, they show “N/A.”
- Otherwise, values are projected from the last running data.
- Label update: “Energy Loss (Currency)” is renamed “Energy (Currency).”
- Bar-chart colors & legend:
- Bars < 0 display green ; bars > 0 display red.
- Legend boxes read “Red: Net Energy Loss” and “Green: Net Energy Savings.”
- Dual y-axis power chart: Power charts now plot horsepower on the left axis and kilowatts on the right (conversion 1 HP =0.746 kW).
Equipment Log Drawer Improvements
Nanoprecise’s equipment sidebar now defaults to the “Active” filter, displaying only assets that have generated at least one notification within the past 180 days.
- Active (default): shows equipment with recent alerts, helping teams focus on current issues.
- Inactive: reveals assets whose last notification is older than 180 days, useful for confirming completed maintenance or dormant machines.
- All: lists every monitored asset, regardless of notification history.
In short, the sidebar filter prioritizes recently active equipment while still providing quick access to historical and comprehensive asset views.
Motor Edit Popup Enhancements
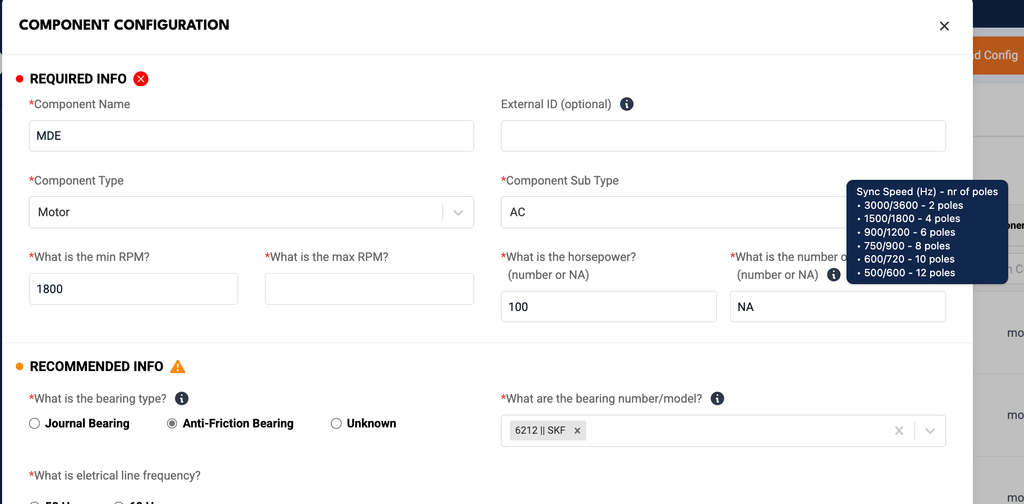
- Tooltip Added for “Poles” Field: To improve usability and provide clearer context, a tooltip has been added to the Poles question in the Motor edit popup for the Number of poles and speed correlation.
- Label Update: The field previously labeled as Horse Power is now updated to Power (hp) for consistency and clarity.
Time Sync Enhancements for newly added or modified Components
Previously, time sync applied to equipment did not automatically extend to newly added or modified components under that equipment . This enhancement ensures consistent time synchronization across all relevant scenarios:
- New Component Addition: When a new component is added under equipment that has already been time synced, the component will now automatically inherit the equipment’s time sync settings.
- Sensor Reassignment: If a component is unassigned and then reassigned a sensor, and the equipment is time synced, the component will now align with the equipment’s time sync configuration.
- New Sensor Assignment: If an existing component without a sensor is later assigned one, it will now also follow the equipment’s time sync settings when the equipment is time synced.
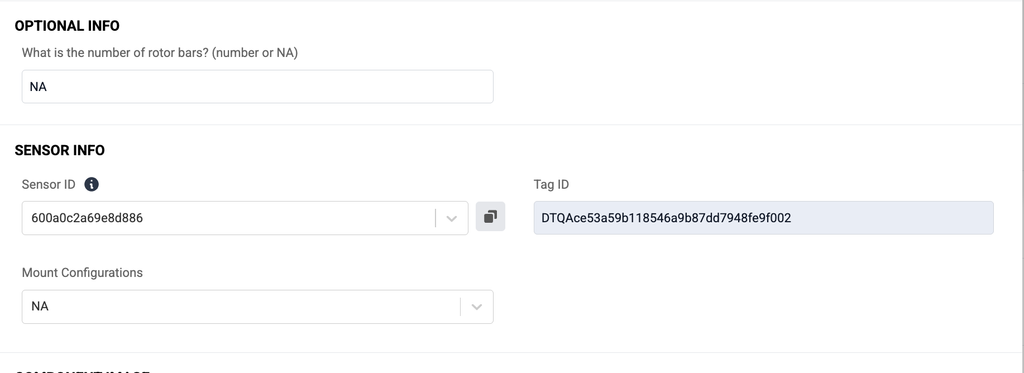
Sensor ID Copy Functionality
Users can now easily copy the Sensor ID directly from the Component Edit screen.
- A Copy icon/button has been added next to the Sensor ID field (if a sensor is assigned).
- Clicking the icon copies the Sensor ID to the clipboard, making it easier to search or reference elsewhere.
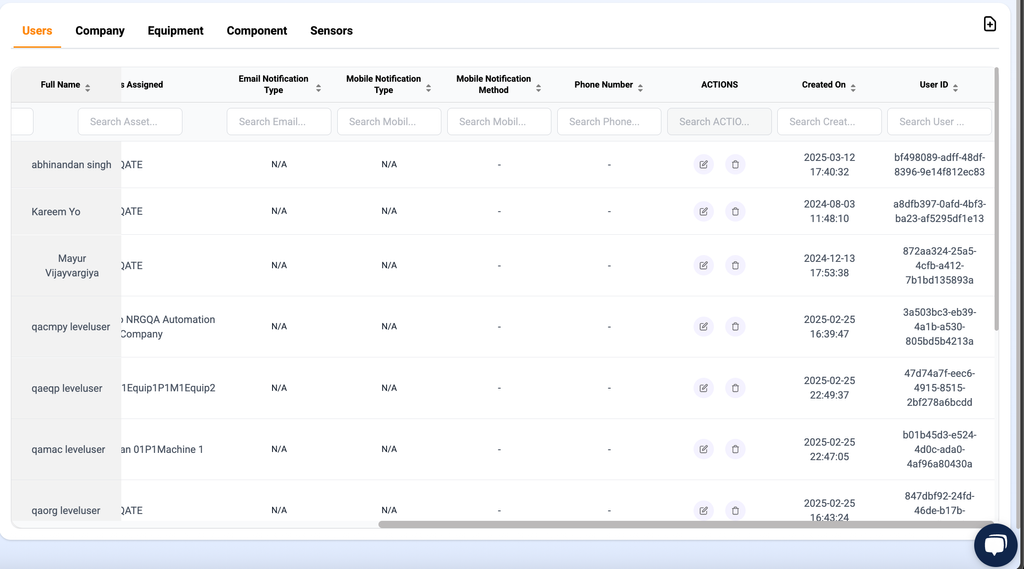
Centralised User Management
Users can now manage application users directly from the User tab under Configuration:
- Add User: A new Add User button allows users to quickly add new accounts.
- Delete User: A Delete option is available under the Actions menu to remove users.
- Going forward, all user management will be centralized within the Configurations dashboard for consistency and streamlined access.
Group Email Notifications by Hierarchy & Access Level
- Group email notifications for the following alerts will now be delivered at Plant, Equipment, and Component levels:
- Last Running Notification
- Sensor Connectivity Alerts
- Battery Notifications
- (Previously only available for Daily Alarm Notifications)
- User Access-Based Delivery: Emails are now sent based on the user’s access level:
- Users with Plant-level access will receive alerts only for plants they have access to.
- Users with Equipment-level access will receive notifications only for the corresponding equipment.
Navigation Update: Speed Graph Option Relocated
The Speed option in the left-hand navigation has been moved for better contextual grouping.
New Position: It now appears between Vibration and Health Summary for a more intuitive layout.
Header Layout Enhancement
The Company/Org Selector and the Time zone Dropdown have been moved to the top page header for better visibility and global accessibility across screens.
Equipment List Page Enhancements
- Column Reordering for improved usability:
- Plant
- Machine (if Machine Table is enabled)
- Equipment
- UI Improvements
- Up & Down Arrows added at the start of each equipment row for additional interactivity or sorting cues.
- Clickable Redirections:
- Clicking on Component redirects to the Component Health Summary.
- Clicking on Equipment redirects to the Equipment Health Summary.
- Auto-refresh to update the equipment list after applying any filters
- Viewing multiple equipment details enabled to expand more than one equipment via the carat symbol