What’s New
Data Relearn
A new Data Relearn workflow has been introduced to help maintain optimal algorithm performance when key changes are detected. This process ensures that system insights remain accurate following significant sensor or configuration adjustments. Users are guided to complete Data Relearn when any of the following Ignore (No Issue) feedback is submitted:
- Sensor Relocation
- Sensor Configuration (Fmax, # samples, etc.)
- Equipment/Component Configuration (Technical Info)
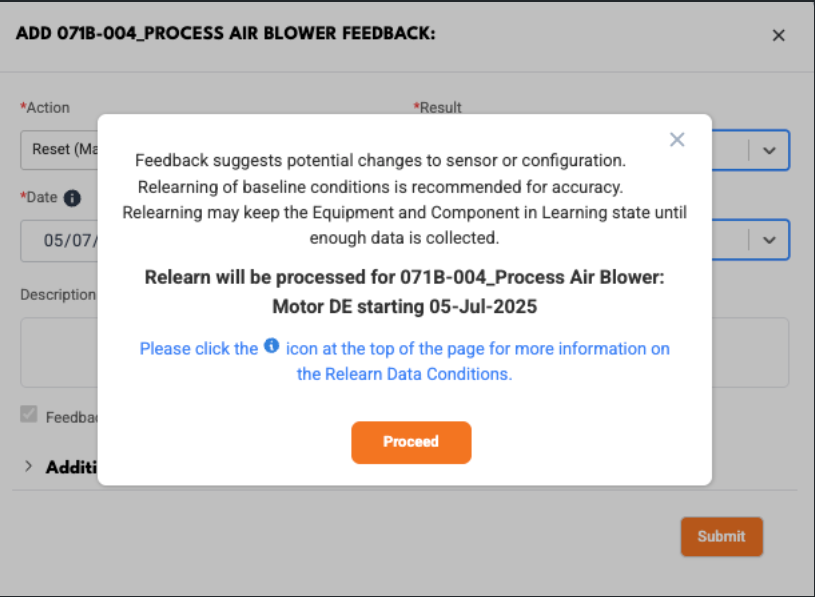
More information on the Date Relearn functionality is available via the information icon in the top navigation pane. The Data Relearn process may require up to 48 hours to complete, during which changes in learning conditions or health status may be observed. Additional support is accessible through the “Contact us” button in the navigation.
Health Status Update Notifications
To deliver critical updates with improved timeliness, automated notifications are now triggered for any change in equipment health status while the equipment is running. These notifications are sent exclusively via email, ensuring that key personnel are promptly informed while minimizing dashboard interruptions.
Health Status Update notifications are available for all notification subscriptions under the label “Health Status Update.”
Email Subjects:

Health Status Updates appear in the Daily Alarm Summary by default, but not in other notification areas such as the notification log, timeline, or equipment log drawer.
Enterprise Metrics Improvements
Several enhancements have been implemented to deliver more meaningful insights and improved management of plant-level operations. These updates help organizations track savings and manage assets more effectively.
- Plant-level savings are now calculated and displayed in the Cost Savings section.
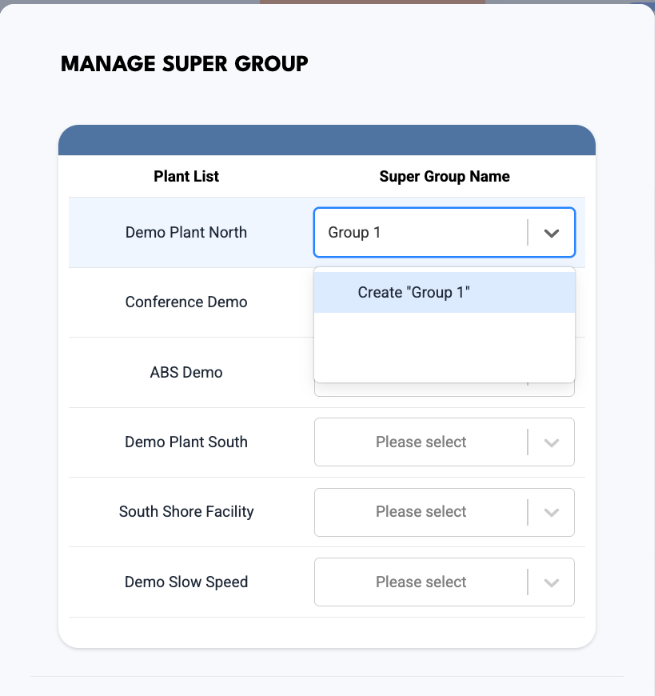
- Super Group management has been enhanced to simplify plant assignment and includes a new toggle to enable or disable Super Group functionality.
Equipment Log Improvements
The equipment log and associated workflows have been refined to improve usability, accuracy, and reporting for maintenance activities. These improvements help users more easily track equipment history and submit precise feedback.
- Health status icons are now displayed next to equipment when selected in the equipment log.
- Improved performance when switching between companies in the equipment log.
- Filter options are now synchronized between the Equipment Log and the All Equipment page.
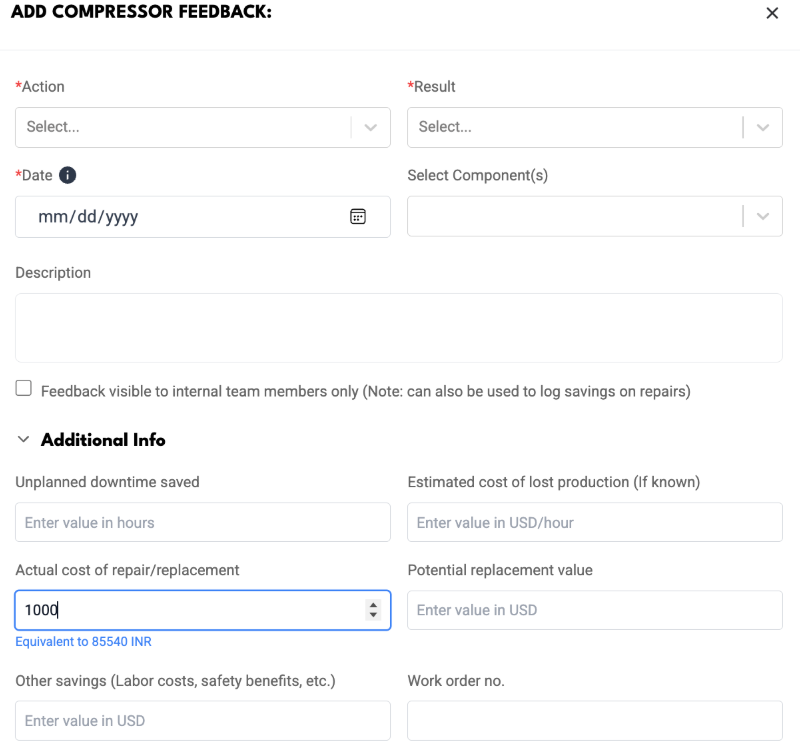
- A local currency conversion has been added to the feedback form, allowing submissions in USD while also displaying local currency equivalents.
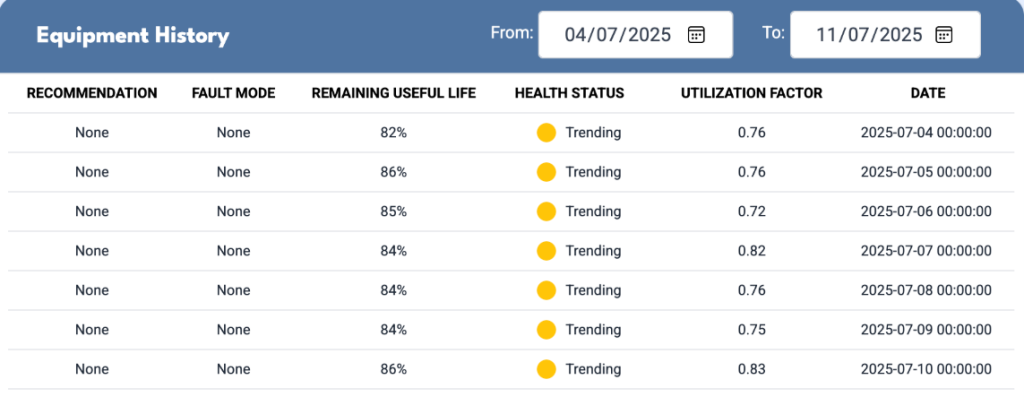
Equipment History Deduplication and Optimization
To address confusion caused by duplicate entries, the equipment history timeline now features enhanced deduplication logic. This update ensures a clearer and more accurate record of changes for every equipment and component.
- Only one entry is kept per equipment/component.
- The worst health status of the day is retained.
- If there is no change in health status or metrics, no new document is created; instead, the existing document timestamp is updated.
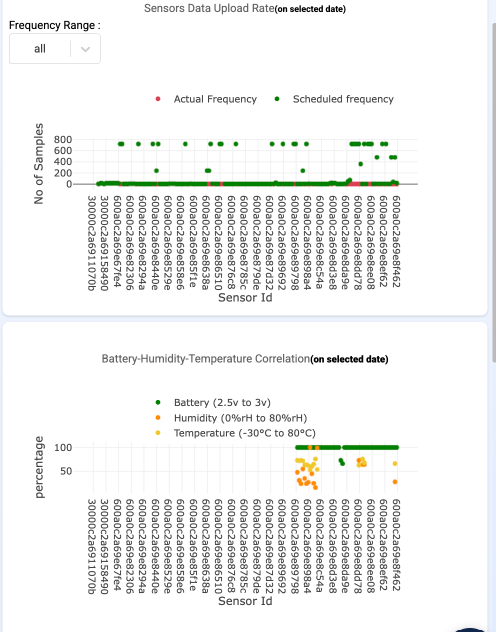
Sorted Sensor IDs in Graphs
Graphical displays on the Sensors page now present Sensor IDs in ascending order, providing more consistent and readable data views for:
- Sensors Data Upload Rate
- Battery-Humidity-Temperature Correlation
Navigation and Labeling Updates
To promote clarity and ease of use, several navigation and labeling updates have been made:
- The left-hand navigation item formerly labeled “Equipment List” has been renamed to “All Equipment,” and the corresponding URL has been updated.
- The “User Management” item has been relocated from the left-hand navigation to the “Users” tab within Configurations for improved organization.
- On Health Summary pages, the left-hand navigation now displays “Sensors” for greater consistency. The main table on the Sensors page is now titled “Sensor Details,” and the tooltip for the download button now reads “Download Sensor Details.”

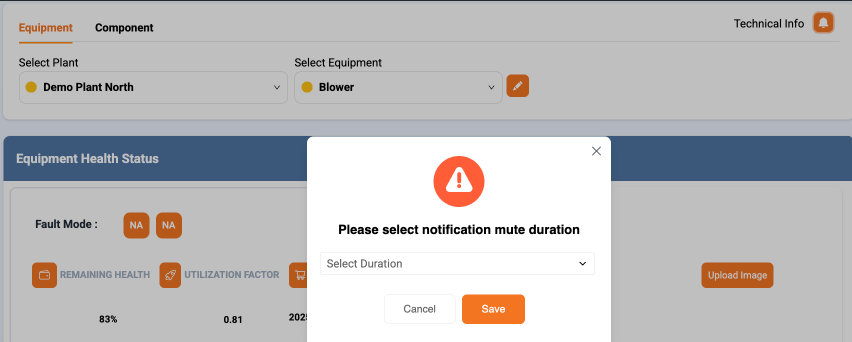
Notification Mute/Unmute Enhancements
Improvements have been made to the notification mute/unmute experience on Equipment and Component tabs to streamline interactions and increase transparency.
- Technical info and mute/unmute icons have been moved to the header for improved visibility.
- When notifications are unmuted, a bell icon is displayed. Hovering over it shows a “Mute Notifications” tooltip.
- Clicking the bell icon opens a popup for selecting mute duration (options unchanged).
- Once muted, the icon changes to a crossed-out bell, with hover text showing remaining mute time.
- Clicking the muted bell icon unmutes notifications immediately.
Configurations Duplicate Asset Popup – UX Improvement
The workflow for duplicating assets has been simplified to minimize unnecessary user interactions:
- The “Duplicate” button in the popup is now enabled by default, allowing immediate action without requiring interaction with the Name field.
Configurations Duplicate Asset Name Restriction – Validation Update
A new validation has been introduced to prevent creation of assets with duplicate names within the same hierarchy level, ensuring data integrity and reducing potential confusion.
Configurations Enhanced Multi-Edit for Components
The multi-edit functionality for components now supports editing across components with different configurations more intelligently.
- Only common settings across selected components are editable and will update for all selected components.
- Settings unique to some components remain editable for those components only, without affecting others.
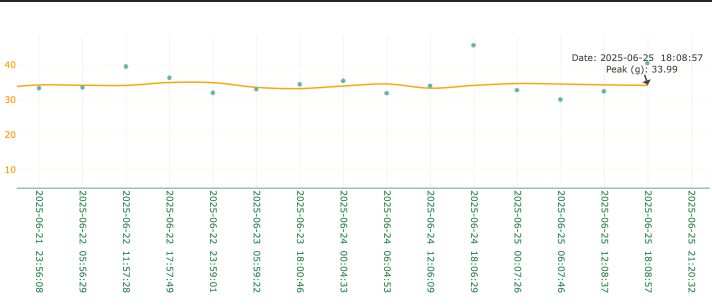
Notification Marker Placement on Smooth Curves
Notification markers in graphs are now accurately positioned on the actual data that trigger the notification smooth curves. This improvement delivers greater clarity and precision in data visualization.